I’ve been working on large email marketing campaigns for years now. A couple of those years were spent leading a team which handled some 3 million emails a month. I learned a lot in these years, but the most valuable lesson I ever learned about email marketing came from Socrates (via Plato):
I know one thing: that I know nothing
The more I learned about email marketing, the more I realised that there is more to learn.
One time, for example, we realised that “less is more” might apply in most regions, and were optimising all our emails to go straight to the point and reduce unnecessary information. We started testing, and noticed that even though this worked well in most regions (it gave us slight, but significant increase in click-throughs), the German market reacted in exactly the opposite way.
Email marketing is a subject that gives you better results with every little bit of effort you put into it, which is why I lap up every little bit of information and data I can find about the subject.
I find Hubspot’s content marketing resources to be an invaluable asset, but I can appreciate that we don’t all have time to go through all their material every time. This is a real pity, because some of their ebooks contain phenomenal insight into various areas of content marketing, including email. The 2014 Science of Email Report, for example, is one of them.
So today I’ve decided to make life a bit easier for you. I went through the 70-page document which is filled with some great data and I’ve condensed it into just over a thousand words and some graphs.
The report is interesting because it combines data from self-reported preferences (which are always interesting) with numbers gathered from Litmus and Signals – two tools that process thousands of emails a day. It’s fascinating to see how people’s self-reported preferences do not always tally with their actions.
I’ve split the report’s findings into a slightly different set of logical groupings than the ones chosen by Hubspot’s team of writers for one simple reason, I’m more interested in the findings and what I can learn from them than the research in its own right, and this is what I’ve learnt:
Less is indeed more when it comes to images
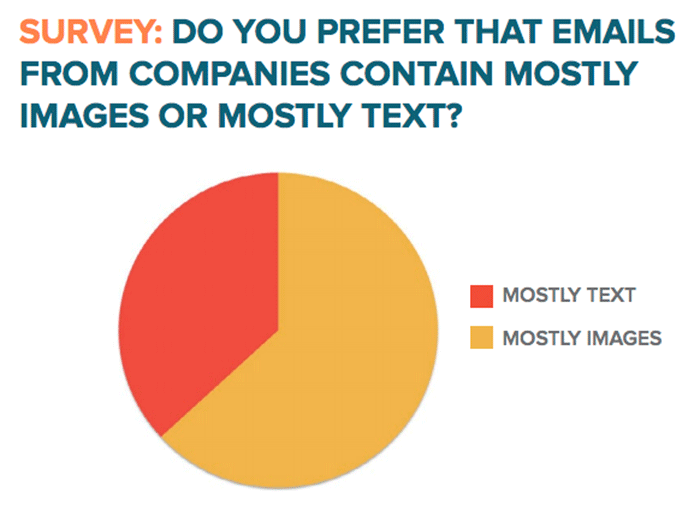
- Users interact more with emails with less images. Even though users reported that they prefer mailers that include more images, in actual fact their behaviour indicated otherwise. Readers tended to interact more with emails that included less images.
- Smaller images work better. As the height of images went up, click through ratio went down. The width of images did not really affect click-through, but this makes sense because even a simple line crossing the page can be considered to be a wide image.

It’s not as easy as we think
- Email marketing is becoming a bigger challenge. Users are buying less via email, they’re reading less emails and a are filtering their email automatically much more (using tools like gmail’s priority inbox). This does not mean you should worry – this is just an opportunity for you to excel and thrive in an inbox which is free of spam.
- Users will report you if you Spam them. 50% of recipients said they report spammy emails. People reporting your email as spam can have devastating effects on your campaigns because it impacts your deliverability significantly.
- Users will give you a dummy email address. 1 in 2 subscribers will use a dummy email address to avoid being spammed. So always reassure visitors to your site that you will not be spamming them, and clean your list from inactives on a regular basis.
It’s time to change your sending patterns
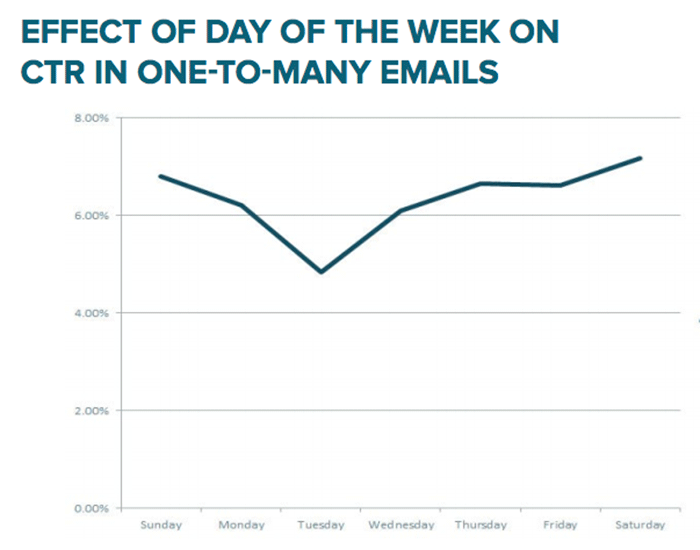
- Forget Tuesdays and Thursdays. Even though it was always recommended to send out your emails on Tuesdays and Thursdays, with everyone sending out emails on the same two days of the week, effectiveness has dropped. Shift the days and times you send your emails at, even weekends work for some companies. Then test, test and test.

Your readers are going increasingly mobile, so you should too
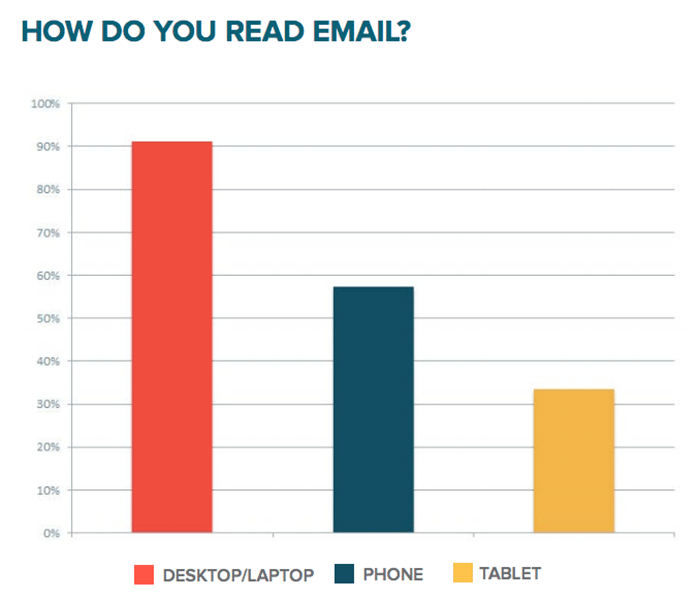
- Desktop remains king. Even though more and more people also check their emails from phones and tablets, desktop remains the main platform for reading emails. Users will read their emails on their phones as they come in but then mark them as unread if they want to take further action later.
- People check email on their phones and tablets. Despite the fact that I just told you that desktop is king, it’s being dethroned. 47% of users open their marketing email on phones or tablets. You can’t afford to send out emails that are not responsive.
- Desktop emails are being read in web clients. As more and more people switch to hosted services (Gmail, Google Apps, Office 365), the number of people reading their emails in Outlook or Apple Mail is in decline.
- iOS has 39% of reported opens. And iOS supports media queries – which means you can design and code versions of your email specifically for iOS. Do so. Every time.

And in the end…
This is just our summary. If you’re running full fledged email marketing campaigns on a regular basis, however, you have to consider reading the 2014 Science of Email Report.
Yes, you have to give Hubspot your email address, but heck, it’s worth it. And they never spam you, they just keep on sending you informative stuff, so worry not.


